Mastering RSI: Identifying Bull and Bear Ranges
Mastering the Relative Strength Index (RSI) requires a deep understanding of its underlying principles, effective interpretation of its signals, and strategic application in various trading methodologies. The Relative Strength Index (RSI) is a momentum oscillator that quantifies the speed and magnitude of price fluctuations. Its value ranges from 0 to 100. The RSI was conceived by J. Welles Wilder, who published his seminal work titled “New Concepts in Technical Trading Systems” in 1978.
Calculation of RSI
The computation of the Relative Strength Index (RSI) involves a series of steps that draw upon the summation of average gains and losses over a predetermined time frame. Please find below a detailed elucidation of the process:
Choose a Time Period
• The default RSI period is 14 days, but traders have the flexibility to adjust this timeframe to align with their specific trading strategies.
Calculate Average Gain and Loss
• Over the specified time period, calculate the average of the gains and the average of the losses.
• Gain is calculated as the difference between the current and previous closing prices, provided that the current price is superior.
• Loss is determined in a comparable manner when the current price is less than the preceding closing price.
Calculate Relative Strength (RS) RS is the ratio of the average gain to the average loss. [ \text{RS} = \frac{\text{Average Gain}}{\text{Average Loss}} ]
Calculate RSI Utilize the RS value to calculate the RSI using the following formula: [ \text{RSI} = 100 - \frac{100}{1 + \text{RS}} ]
Interpretation
• The resulting RSI value oscillates between 0 and 100.
• Values exceeding 70 typically indicate an overbought condition, whereas values below 30 suggest an oversold condition.
This calculation aids traders in identifying potential reversal points in the market by indicating whether an asset is potentially overbought or oversold. As an integral component of a well-rounded strategy, RSI can be integrated with other indicators to corroborate trends and thereby enhance trading decisions.
Relative Strength Index (RSI) values exceeding 70 typically suggest that a security is experiencing excessive buying pressure or overvaluation. This phenomenon may indicate a potential trend reversal or a corrective price movement.
Over the years, the Relative Strength Index (RSI) has undergone a gradual adjustment in its level thresholds. Currently, an RSI level of 80-85 is considered optimal for detecting reversals from the peak, while RSI levels between 85 and 90 are more effective for identifying reversals in large-cap stocks. Conversely, a level approximately between 90 and 95 is suitable for mid and small-cap stocks.
Relative Strength Index (RSI) values below 30 typically suggest that a security is experiencing oversold conditions or undervaluation. This may indicate a potential trend reversal or corrective rally.
Over the years, the Relative Strength Index (RSI) has undergone adjustments in its threshold levels. Currently, an RSI level of 20-25 is optimal for identifying index reversals from the bottom, while 15-20 levels are most effective for large-cap stocks. Conversely, a level around 10 is suitable for mid and small-cap stocks.
For RSI threshold levels to be effective, it is imperative to consider the time frame, as it significantly influences decision-making processes.
Higher time frames (daily, weekly, and monthly) are more reliable for applying the aforementioned RSI levels to indices, large-cap stocks, mid-cap stocks, and small-cap stocks.
In shorter time frames, such as 5, 15, and 45 minutes, as well as hourly charts, it is advisable to employ an RSI band of 10-15 for oversold conditions and 85-90 for overbought conditions when making trading decisions.
In the context of mastering the Relative Strength Index (RSI), A Regular Bullish Divergence is a crucial concept to comprehend, particularly for the development of effective trading strategies. This divergence is defined as a situation where the RSI oscillator rises above its 50-period moving average while the price of the underlying asset falls below its 50-period moving average. This divergence serves as a signal that a bullish trend may be weakening or reversing, indicating potential opportunities for traders to exit their positions or initiate new long positions.Overbought and Oversold Levels
Regular Bullish Divergence
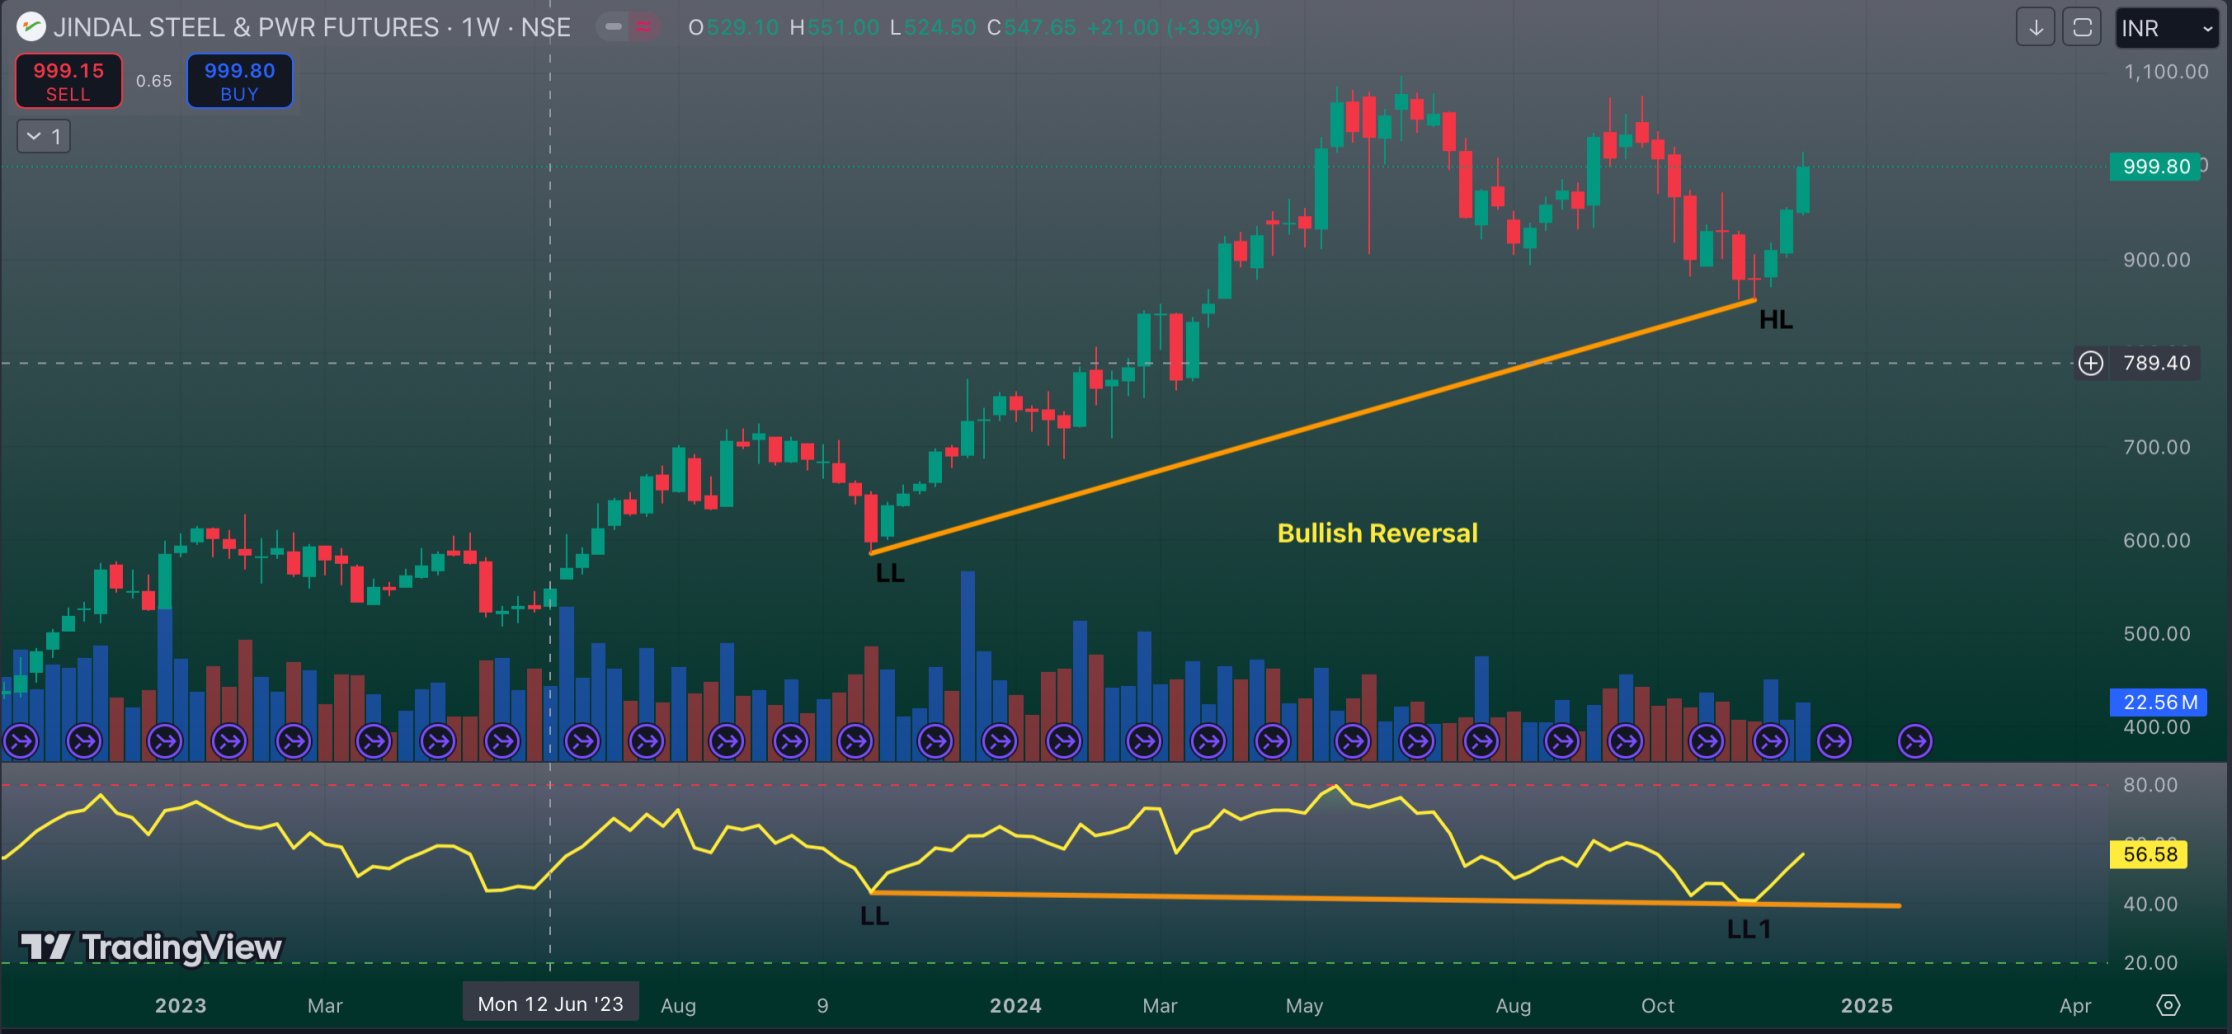
A regular bullish divergence occurs when the price of an asset reaches a new low, yet the RSI fails to confirm this low, remaining either unchanged or even exhibiting a higher low. This discrepancy implies a weakening of downward momentum, potentially signaling a reversal or upward movement in the price. Traders interpret this as an indication to potentially assume long positions or anticipate a bullish reversal.RSI Divergences
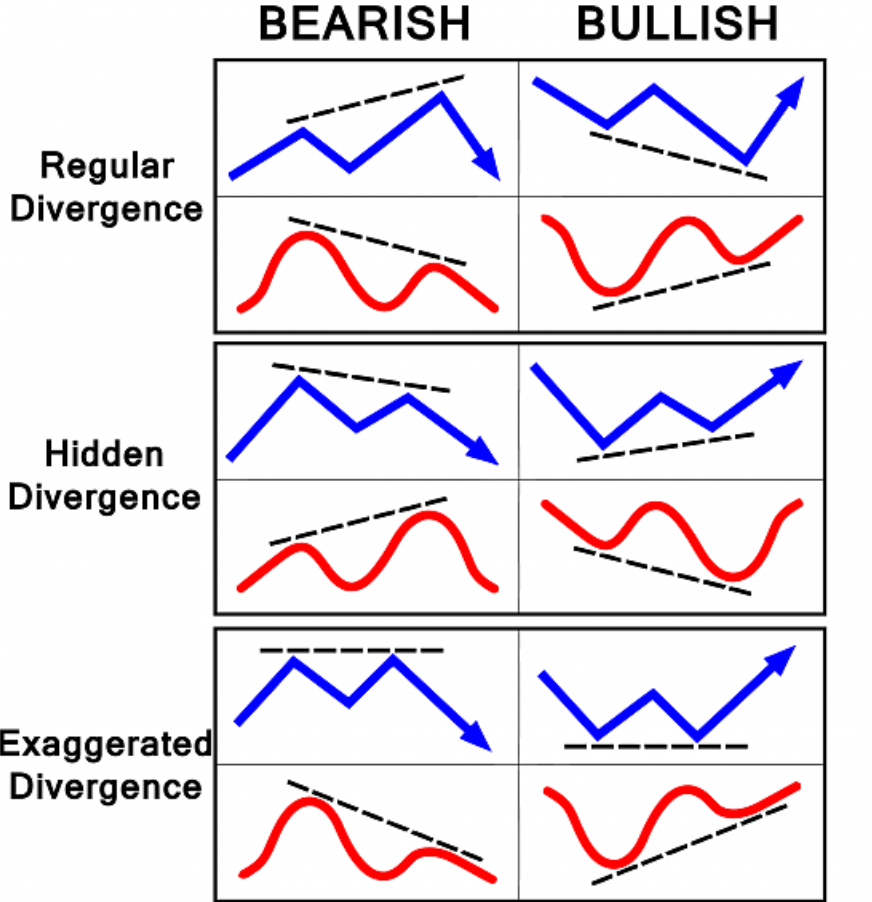
Divergences occur when the Relative Strength Index (RSI) deviates from the price action of an asset. These deviations can serve as potential signals for trend reversals. In the context of RSI, divergences are interpreted as follows:
The Regular Bullish Divergence is a pivotal concept in technical analysis, particularly when using the Relative Strength Index (RSI) as a momentum oscillator. Here are the key characteristics:Key Characteristics of Regular Bullish Divergence
1. Price Action:
During a downtrend, the asset’s price experiences lower lows.
2. RSI Behaviour:
The Relative Strength Index (RSI) either maintains a consistent level or experiences progressively higher lows, even as the price experiences new lows.3. Implication:
This divergence indicates a possible termination of the downward trend and an imminent upward reversal in the price trajectory.Practical Application in Trading
Identifying Entry Points
• Traders frequently employ bullish divergence as a signal to initiate long positions, anticipating a subsequent price rise.Risk Management
• It is crucial to verify RSI divergence signals with other indicators and conduct further analysis before executing trades.Market Context
• Analyzing broader market conditions, such as support and resistance levels, assists in confirming the veracity of divergence signals.By systematically identifying and judiciously employing regular bullish divergence signals, traders can enhance their capacity to anticipate market reversals and refine their trading methodologies. Incorporating these signals into a comprehensive technical analysis framework bolsters decision-making capabilities and facilitates alignment with prevailing market trends.
Hidden Bullish Divergence
A concealed bullish divergence is a technical analysis concept that employs the Relative Strength Index (RSI). This divergence functions as a signal indicating the continuation of an uptrend rather than a reversal. In contrast to conventional divergences, which signal reversals, concealed divergences affirm the prevailing trend.Hidden bullish divergence offers traders a unique insight into potential continuations in market trends, distinguishing itself from regular divergence by signaling that the current trend may continue. This understanding can enhance strategic decision-making in trading.
Hidden bullish divergence is a valuable tool for traders for several reasons are:-
• Trend Confirmation:
Hidden bullish divergence acts as a confirmation of the current uptrend. Unlike regular divergence which signals potential trend reversals, hidden divergence reinforces the continuation of the trend, providing traders with confidence to maintain or enter long positions.• Timing of Entries:
It helps traders identify optimal entry points during pullbacks in an uptrend. When the price makes a higher low but the RSI shows a lower low, it suggests that the uptrend is likely to resume, making it a strategic point to enter the market.• Enhanced Risk Management:
By using hidden bullish divergence in conjunction with other technical indicators, traders can enhance their risk management strategies. It provides assurance that the upward momentum is still intact, reducing the risk of entering trades against the trend.• Market Insights:
Hidden bullish divergence offers deeper insights into market dynamics by highlighting the internal strength of a trend even when the price temporarily pulls back. This understanding can lead to more informed trading decisions and improved strategy development.• Strategic Advantage:
For traders, identifying hidden bullish divergence can provide a strategic advantage by allowing them to capitalize on market conditions that might not be immediately apparent from price action alone. This nuance helps in crafting a more comprehensive trading strategy that aligns with prevailing market trends.Overall, hidden bullish divergence is a crucial tool that supports traders in confirming trend continuations, timing their trades effectively, and managing risk, thus enhancing their overall trading strategy.
Identifying Hidden Bullish Divergence in Technical Analysis.
Hidden bullish divergence is a crucial concept in technical analysis that assists traders in identifying the continuation of an uptrend. Unlike conventional divergences, which signal potential reversals, hidden divergences convey the continuation of the prevailing trend. Here’s how to discern hidden bullish divergence:
Identnify Price Action:
• Locate a price pattern where the asset experiences higher lows. This indicates an uptrend, albeit with the potential for corrections or pullbacks within this trend.
1. Analyze RSI Movement:
Observe the Relative Strength Index (RSI). During hidden bullish divergence, the RSI will exhibit lower lows while the price simultaneously makes higher lows. This discrepancy suggests that the correction phase may be concluding, and the original uptrend is likely to persist.2. Confirm with Additional Indicators:
To enhance the reliability of the divergence signal, corroborate it using supplementary technical indicators such as moving averages, trend lines, or support and resistance levels.Let us analyze a practical scenario employing the RSI indicator. Consider a stock whose price experienced a decline to 50, subsequently surged to 60, and subsequently retreated to 55 before resuming its upward trajectory. Concurrently, the RSI indicator registered a bottom at 30 when the price was 50, experienced an upward movement, and subsequently descended to 25 when the price reached 55. In this instance, the price achieved a higher low (55 in comparison to 50), while the RSI registered a lower low (25 in comparison to 30). This divergence suggests the presence of concealed bullish sentiment and implies the continuation of the upward trend.
Chart Example:
Hidden bullish divergence, a potent yet frequently overlooked technique in a trader’s arsenal, enables the identification of subtle indicators of strengthening momentum. By recognizing these indicators, traders can gain a strategic advantage in anticipating market fluctuations. Integrating hidden bullish divergence into your technical analysis can bolster your confidence in navigating the markets, facilitate more informed trading decisions, and ultimately lead to more favorable trading outcomes. It is crucial to remember that, like any technical indicator, hidden bullish divergence should not be employed in isolation. Its effectiveness is maximized when combined with other analysis tools and sound risk management practices.
Bearish Divergence:
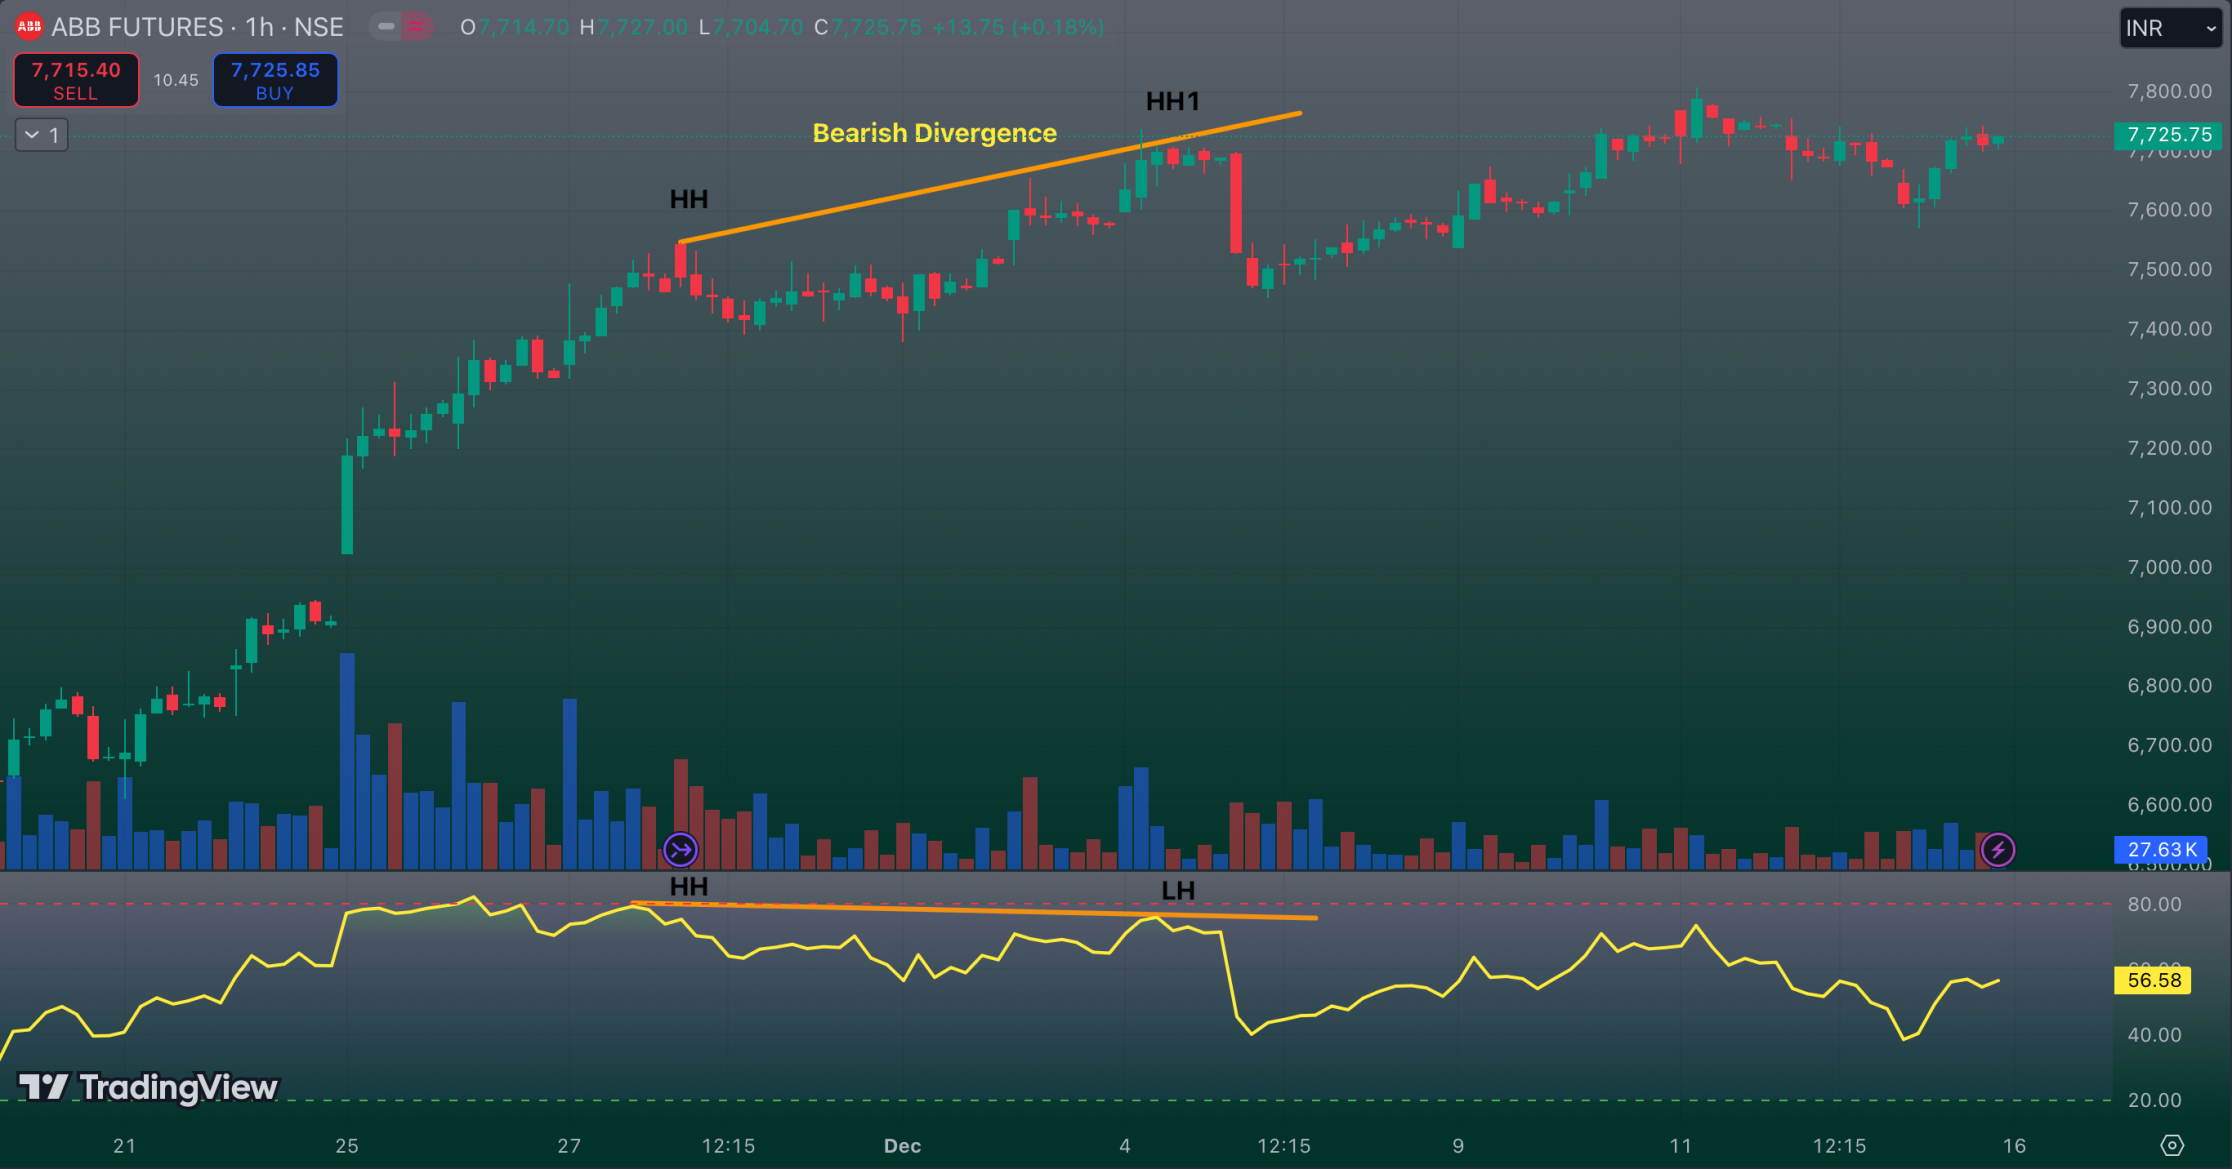
Bearish Divergence in technical analysis occurs when an asset’s price reaches a new high, yet the Relative Strength Index (RSI) fails to do the same, failing to attain a new high of its own. This divergence between price action and RSI signals a potential weakening of the upward momentum, indicating that the current uptrend may be losing momentum and a downward reversal is imminent.
Key Characteristics of Bearish Divergence:
• Price Action:
The asset's price climbs to a new high.• RSI Behaviour:
Lower highs in RSI.• Implication:
This divergence suggests a potential reversal of the current upward trend, implying a possible downturn may follow.Practical Application in the Field of Trading
• Identifying Exit Points:
Traders may consider exiting their long positions to secure profits or mitigate potential losses, anticipating a potential price decline.
• Initiating Short Positions:
Some traders may interpret this as a signal to initiate short positions, wagerring on a reversal in the price trend.
• Risk Management:
It is crucial to corroborate bearish divergence signals with other indicators and conduct a thorough market analysis to enhance the reliability of the decision-making process before executing trades.
By comprehending and judiciously employing bearish divergence signals, traders can augment their capacity to discern market reversals and refine their trading strategies. Integrating these signals with complementary technical analysis instruments can furnish a more holistic perspective on market dynamics, thereby enhancing decision-making processes.
Example Scenerio
1. Initial Price Increase:
The stock price experiences an upward trend, rising from 100 to 110. Concurrently, the Relative Strength Index (RSI) indicator surpasses the threshold of 70.
2. Further Price Increase:
The price continues to rise to 115, while the RSI has now reached only 65.
3. Reversal Signal:
Despite the recent price surge, the lower high in the Relative Strength Index (RSI) indicates a potential weakening of the bullish momentum. This could signal an opportune moment for a selling move.
Chart Example:
Hidden Bearish Divergence:
Hidden bearish divergence is a technical analysis concept employed by traders to discern potential trend continuations in a market. In contrast to conventional bearish divergence, which signals a potential reversal, hidden bearish divergence suggests that the prevailing downtrend may persist. This divergence holds significance for traders seeking to capitalize on the prevailing bearish momentum.
Key Characteristics of Hidden Bearish Divergence :-
1. Lower High in Price:
The initial prerequisite for a hidden bearish divergence is that the price forms a lower high. This indicates that the asset’s price is encountering difficulties in surmounting previous high levels.
2. Higher High in Indicator:
Concurrently, the selected technical indicator should also establish a higher high. This divergence between the price action and the indicator suggests that the momentum propelling the price upward is not as robust as it may seem.
3. Continuation of Downtrend:
Unlike conventional divergence, which frequently signals a trend reversal, hidden bearish divergence signifies the continuation of the prevailing downtrend. It serves as a cautionary indicator that the bullish momentum may be waning, and the bearish trend may regain momentum.
Hidden bearish divergence serves as a valuable tool for traders, offering several advantages
• Early Warning System:
• Trend Confirmation:
• Risk Management:
Identifying concealed bearish divergence entails a series of straightforward steps
• Select a Reliable Indicator:
• Analyze Price Action:
• Compare with Indicator:
• Confirm with Volume::